April 6, 2016 Joshua Ruskin
SANTA ROSA DENTISTPPC Case Study
Increased Conversion Rate by 500%
Client Info
BRIEF DESCRIPTION
Brief Intro
Dr. Harry Albers
Dr. Albers is an award-winning Santa Rosa dentist, clinician, educator, author, researcher and leader in restorative dentistry and a genial professional. His state of the art office and highly trained staff provide a comfortable experience in meeting all of their clients’ dental needs.
Santa Rosa cosmetic dentist Dr. Albers has received over a dozen awards for excellence in teaching, exceptional professional service, academic accomplishments, and significant professional contributions to the art and science of dentistry, over the past two decades.
“Dr. Harry Albers” or “Santa Rosa Dentist” in center part Dr. Albers completed a general practice residency at the Veteran’s Administration Hospital in San Francisco. He taught fixed prosthodontics at the University of California Dental School in San Francisco and taught operative dentistry at the University of the Pacific Dental School in San Francisco. In 1987, he limited his teaching to postgraduate dental education.
During the past twenty-five years Dr. Albers has written several dental texts and lectured extensively on cosmetic dentistry, tooth-colored restoratives, direct and indirect veneers, bonded posterior restorations, fixed prosthodontics, temporization, impression techniques, and other aspects of clinical dentistry. His best-selling text, Tooth Colored Restoratives, is widely acclaimed as the most comprehensive clinical text on cosmetic and adhesive dentistry. It is in its eighth edition and has been translated into two foreign languages.
The
Challenges
- There were no negative keywords on the account creating a lot of wasted clicks.
- Campaigns and Ad Groups were very broad and not targeting specific client for desired service.
- Had a very limited amount of ads (only 1-2 ads) per Ad Group that weren’t optimized.
- Account was not engaged in day parting or bid adjustments to optimize for clicks and conversions.
- Targeting was set as a single location without any bid adjustments.
- Click through rates (CTR) was mediocre at 1.19% and weren’t at all focused on conversions which were hurting overall account performance.
The
Solutions
- Made a large Negative Keyword list on the account level so we started getting good clicks with a much higher conversion rate.
- Broke up Ad Groups into highly concentrated groups (Noun/Verb strategy) that drastically increased click through rates and conversion rates.
- Added at least 3 ads per Ad group including mobile ads and optimized them for clicks and conversions each month.
- Setup time parting to bid higher on peak hours and days and increased mobile bids to increase the number of phone calls client was receiving.
- Engaged in radius targeting around business location and bid more heavily an areas closer to the clients office.
- Optimized keywords, ads, and targeting to get click through rates up to 4.23% (well above Google’s average 1% click through rate) while maintaining the same average ad position (2.4)
Santa Rosa Dentist
Data Sheet
January 2015 – January 2016 |
|||||||||||||
| Jan 2015 | Feb 2015 | Mar 2015 | Apr 2015 | May 2015 | Jun 2015 | Jul 2015 | Aug 2015 | Sept 2015 | Oct 2015 | Nov 2015 | Dec 2015 | Jan 2016 | |
| Impressions | 15,404 | 9,000 | 9,656 | 9,564 | 7,877 | 7,413 | 7,674 | 8,084 | 7,435 | 7,168 | 6,506 | 7,007 | 7,941 |
| Clicks | 183 | 248 | 334 | 376 | 317 | 291 | 387 | 373 | 311 | 325 | 280 | 254 | 336 |
| CTR | 1.19% | 2.76% | 3.46% | 3.93% | 4.02% | 3.93% | 5.04% | 4.61% | 4.18% | 4.53% | 4.30% | 3.62% | 4.23% |
| Avg. POS | 2.4 | 2.6 | 2.4 | 2.5 | 2.6 | 2.4 | 2.5 | 2.4 | 2.3 | 2.5 | 2.6 | 2.6 | 2.5 |
| Avg. CPC | $3.94 | $4.77 | $4.95 | $4.82 | $4.23 | $4.60 | $4.05 | $4.10 | $4.38 | $4.11 | $4.52 | $4.38 | $4.07 |
| Cost | $721 | $1,182 | $1,654 | $1,813 | $1,342 | $1,337 | $1,566 | $1,530 | $1,360 | $1,336 | $1,266 | $1,113 | $1,368 |
| Conversions | 1 | 7 | 20 | 20 | 21 | 52 | 41 | 42 | 44 | 40 | 39 | 45 | 52 |
| Cost/Conv. | $495.62 | $163.17 | $79.01 | $86.98 | $61.22 | $24.09 | $36.42 | $35.12 | $29.46 | $30.74 | $31.51 | $24.51 | $25.72 |
| Conv. Rate | 0.83% | 2.92% | 6.23% | 5.51% | 6.89% | 18.98% | 11.08% | 11.86% | 14.97% | 13.29% | 14.29% | 17.93% | 15.81% |
| Bounce Rate | 84.85% | 76.89% | 83.11% | 84.95% | 88.16% | 78.48% | 85.43% | 82.62% | 76.11% | 81% | 75.24% | 76.96% | 74.42% |
| Pages/Session | 1.35 | 1.57 | 1.52 | 1.35 | 1.29 | 1.52 | 1.39 | 1.35 | 1.45 | 1.35 | 1.41 | 1.37 | 1.53 |
| Avg. Session Duration | 32 | 26 | 32 | 25 | 33 | 28 | 20 | 22 | 30 | 36 | 53 | 31 | 47 |
| % of New Sessions | 83.33% | 87.56% | 82.45% | 81.61% | 86.53% | 90.13% | 82.12% | 82.27% | 74.49% | 78.60% | 80.48% | 76.96% | 82.56% |
| Phone Impressions | 0 | 1,055 | 2,692 | 3,638 | 2,910 | 2,962 | 3,200 | 3,370 | 3,162 | 3,032 | 2,446 | 2,550 | 3,107 |
| Phone Calls | 0 | 8 | 27 | 44 | 36 | 39 | 59 | 54 | 51 | 59 | 43 | 46 | 61 |
| PTR | 0.00% | 0.76% | 1.00% | 1.21% | 1.24% | 1.32% | 1.84% | 1.60% | 1.61% | 1.95% | 1.76% | 1.80% | 1.96% |
Result
Graph Description
Conversions
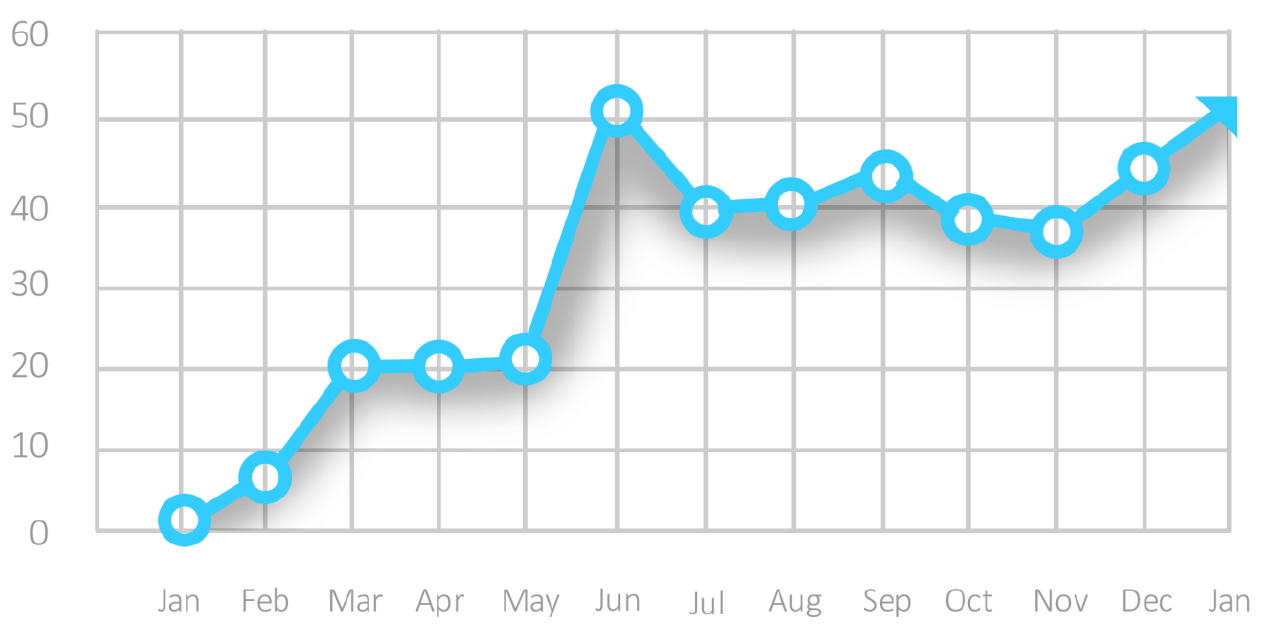
Conversions went up 50 times compared to the first month. With an average of 42.4 conversions a month, combined efforts in making sure that Ads are being seen, relevant and with effective landing pages paved the way in realizing this accounts success.
Phone Calls
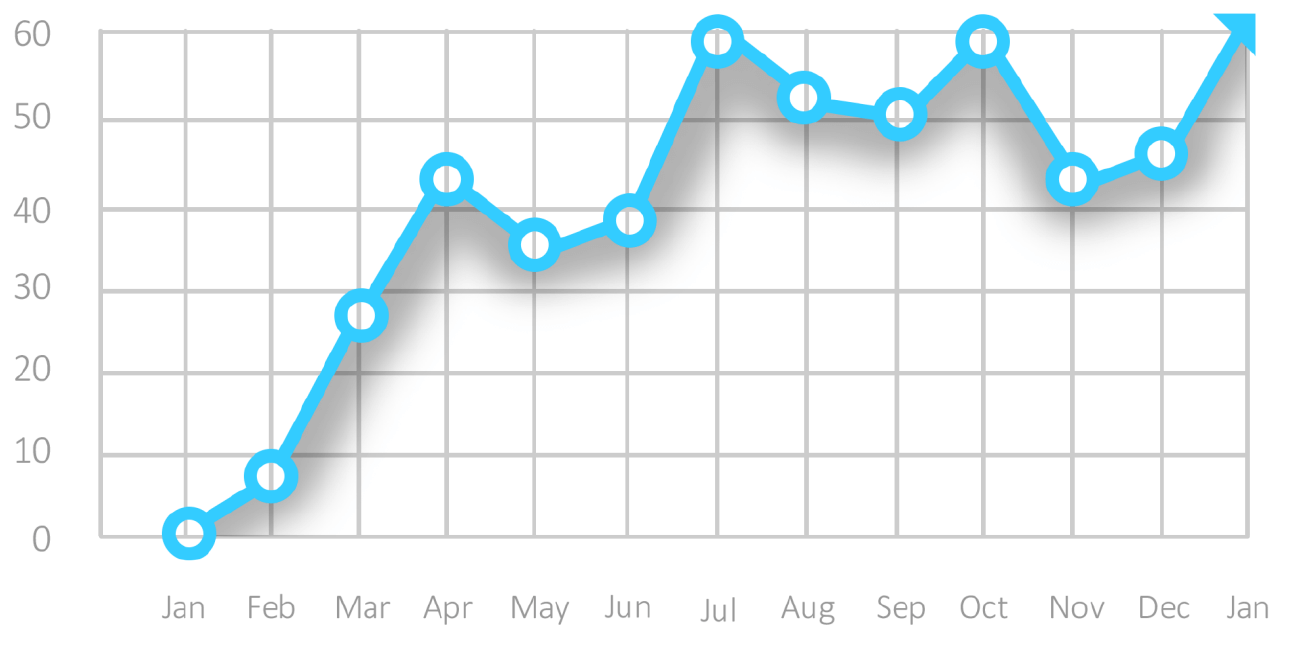
The best conversions are phone calls at least in this kind of industry. From 0 recorded calls in January 2015, to 61 calls in January 2016, it validates this account being successful. Applying call out extensions on the Ads helps potential customers reach out to the business itself faster without any hustle and this is one thing that we’ve always leveraged on.
Click through Rate
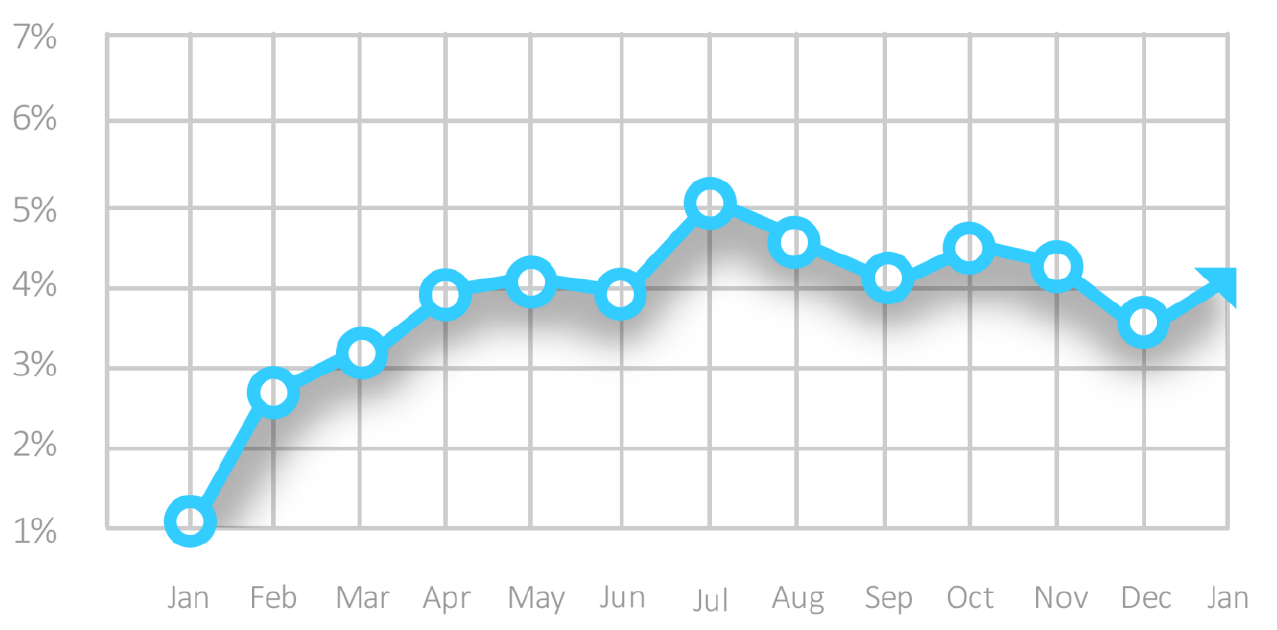
Writing Ads can be tricky sometimes. You only have limited characters you can put in an Ad so you need to out your best foot forward. For this account, we made sure that Ads were relevant to the “money keywords” and at the same time ensuring that CTA’s Call to Action are present. This gave us 4.23% click through rate well above Google’s 1% CTR.
Cost per Conversion
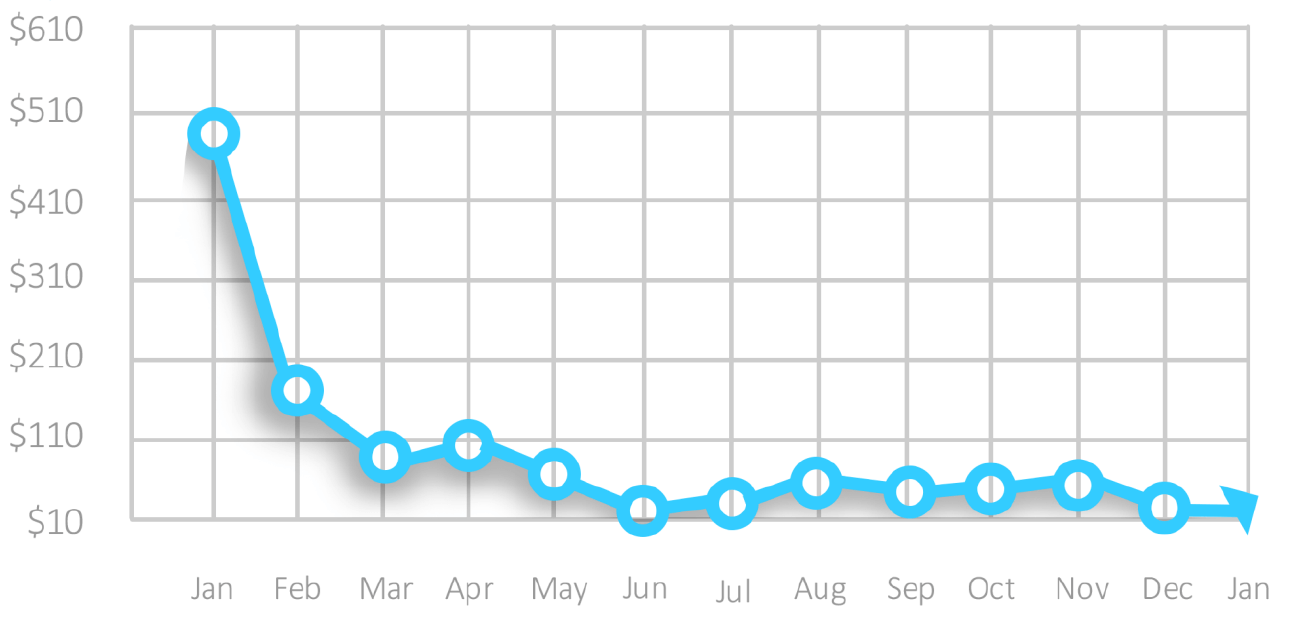
Less cost and more conversions is always one thing that you want to achieve. You want to make sure that your cost is way lower than what you will be making on that specific conversion. From $495.62 per conversion in January 2015 to $25.72 in January 2016, account has been saved lots of money!
Bounce Rate
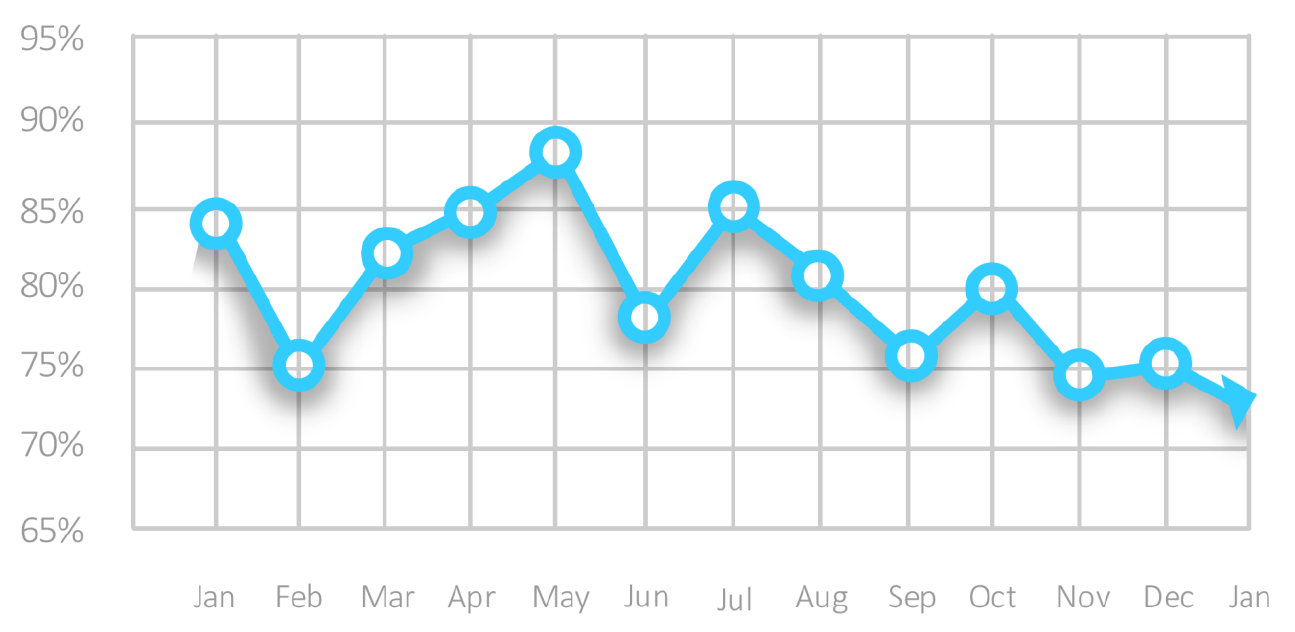
There are few factors that contribute to a bounce rate. By definition it is the percentage of a single session into a web page. With this account, we made sure that when a customer clicks on the Ad, they are driven into a page where they would find exactly what they are looking for. Over the course of 12 months we’ve managed to lower the bounce rate a little over 10%.