April 6, 2016 Joshua Ruskin
MATHEWS MECHANICALPPC Case Study:
Increased Conversion Rate by 900%
Client Info
BRIEF DESCRIPTION
Brief Intro

In August of 1991, Jeff Mathews opened a small, garage-based business with a simple mission: he wanted to help people solve their problems. Since then, Mathews Mechanical has grown from a one-man operation into a premier industrial maintenance, repair, and custom fabrication shop. We’ve built an exceptional team of experienced engineers, service technicians, welders, fabricators, and salesmen, all supported by a knowledgeable and friendly administrative staff.
Customer satisfaction is our first priority, and one of the main reasons for our 20+ years of success! We offer high quality products and services at competitive prices.
Mathews Mechanical provides a “One-Stop Shop” for your material handling, manufacturing equipment, and machinery needs. Our company specializes in industrial and facilities preventative maintenance, repair, and installation. We also offer supplemental in-house fabrication, mechanical design, and structural engineering to fully address our customers’ job requirements from start to finish.
Specializes In
- Preventative Maintenance, Repair & Installation
- Material Handling & Machine Design
- Fall Protection Systems
- Crane Rigging
- Custom Fabrication & Mechanical Engineering
Mission
At Mathews Mechanical our mission is simple; we help people solve their problems. Our team is dedicated to consistently providing clients with high quality service and products in a timely manner. We strive to be the premier industrial maintenance and custom fabrication shop for the San Francisco Bay Area and beyond.
The
Challenges
- Click through rate was very low at 0.39% (CTR) which was hurting the keyword quality scores and overall account performance.
- There were few goals and conversions setup on the account which makes it difficult to tell if indeed the campaign is working or not.
- Campaigns and Ad Groups were very broad and not targeted.
- The average Ad position is not that good with an average of 4.8 which in theory would put the Ad on the right side of the search results. That being said, it would be difficult to get a click.
- There were no Negative Keywords added on the campaigns which gives a lot of wasted clicks and eventually making the campaign lose money and not getting enough conversions.
- Conversion rate is way too low at 0 conversions for the month of March 2015.
The
Solutions
- Optimized keywords, ads, and targeting to get click through rates up to 2.91% (well above Google’s 1% CTR) at the same time improving the ad position to 3.
- Once we installed the proper tracking codes, we increased conversions by 678%.
- We created themed Ad Groups and Campaigns which generated quality clicks and increased our click through rate by over 900%.
- We made sure that the keywords are relevant to their associated Ad Groups, relevance of the ad text, and landing page relevancy.
- We added negative keywords on the campaigns to make sure Ad does not appear on irrelevant keywords which resulted into quality clicks.
- Wrote better Ads for better CTR and making sure that the landing pages are relevant gradually increased the conversion rate by 610%.
Mathews Mechanical
Data Sheet
March 1 – October 31, 2015 |
|||||||||||||
| March | April | May | June | July | August | Sept. | Oct. | ||||||
| Impressions | 69,370 | 57,565 | 28,463 | 16,245 | 17,026 | 14,924 | 19,613 | 14,576 | |||||
| Clicks | 225 | 223 | 418 | 261 | 260 | 291 | 322 | 326 | |||||
| CTR | 0.32% | 0.39% | 1.47% | 1.61% | 1.53% | 1.95% | 1.64% | 2.24% | |||||
| Avg. POS | 5 | 4.8 | 3.6 | 3.7 | 3.7 | 3.5 | 3.2 | 3 | |||||
| Avg. CPC | $2.29 | $2.35 | $1.80 | $2.71 | $2.62 | $2.52 | $2.70 | $3.01 | |||||
| Cost | $516.37 | $523.56 | $751.00 | $706.02 | $680.43 | $733.52 | $868.08 | $980.25 | |||||
| Conversions | 0 | 9 | 38 | 22 | 27 | 28 | 24 | 61 | |||||
| Cost/Conv. | $0.00 | $58.17 | $19.72 | $32.09 | $25.20 | $25.98 | $35.65 | $16.07 | |||||
| Conv. Rate | 0.00% | 4.04% | 9.11% | 8.43% | 10.38% | 9.69% | 7.52% | 18.71% | |||||
| Bounce Rate | 68.47% | 71.16% | 71.99% | 72.80% | 74.71% | 70.22% | 76.47% | 66.46% | |||||
| Pages/Session | 1.68 | 1.53 | 1.59 | 1.64 | 1.57 | 1.62 | 1.4 | 1.78 | |||||
| Avg. Session Duration | 37 | 30 | 31 | 30 | 33 | 25 | 36 | 67 | |||||
| % of New Sessions | 90.99% | 92.56% | 89.68% | 90.40% | 85.82% | 88.97% | 89.22% | 83.69% | |||||
| Phone Impressions | 1509 | 1105 | 3687 | 2361 | 2212 | 2228 | 3325 | 2210 | |||||
| Phone Calls | 0 | 2 | 1 | 1 | 4 | 4 | 4 | 4 | |||||
| PTR | 0.00% | 0.18% | 0.03% | 0.04% | 0.18% | 0.18% | 0.12% | 0.18% | |||||
Result
Graph Description
Clicks
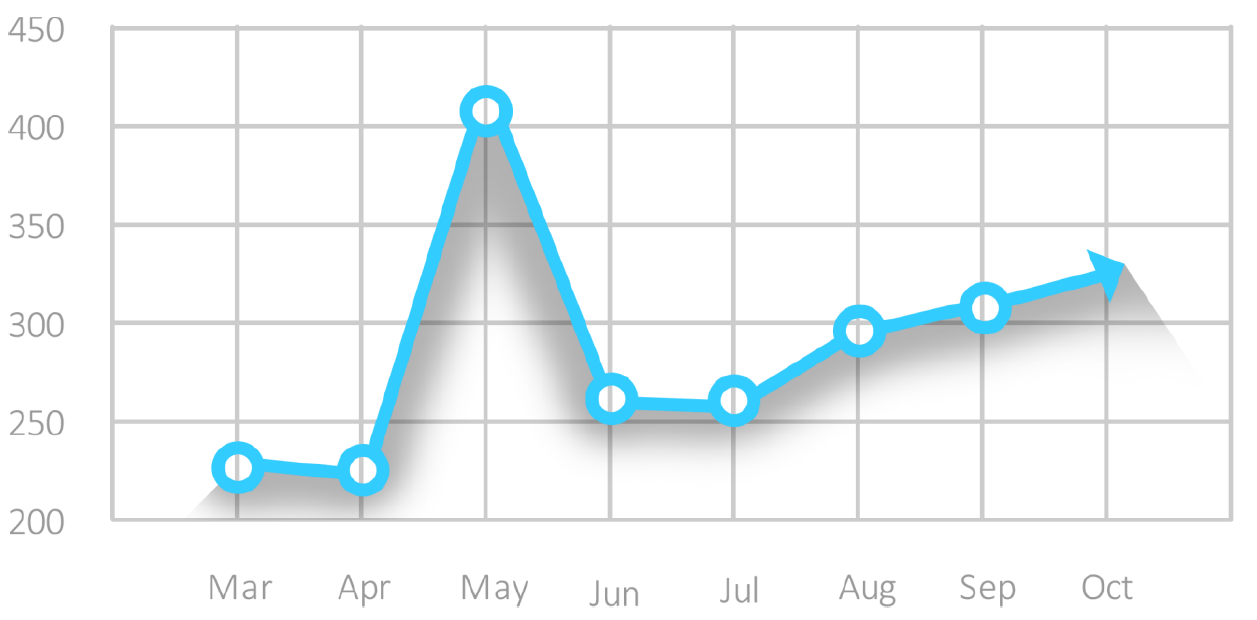
This graph shows the monthly clicks from March 2015 to October 2015. By constantly adding negative keywords, Ads refinement, and bid adjustments the campaign is averaging at 294 clicks. Conversion rate is also at an average of 8.8%.
Click Through Rate
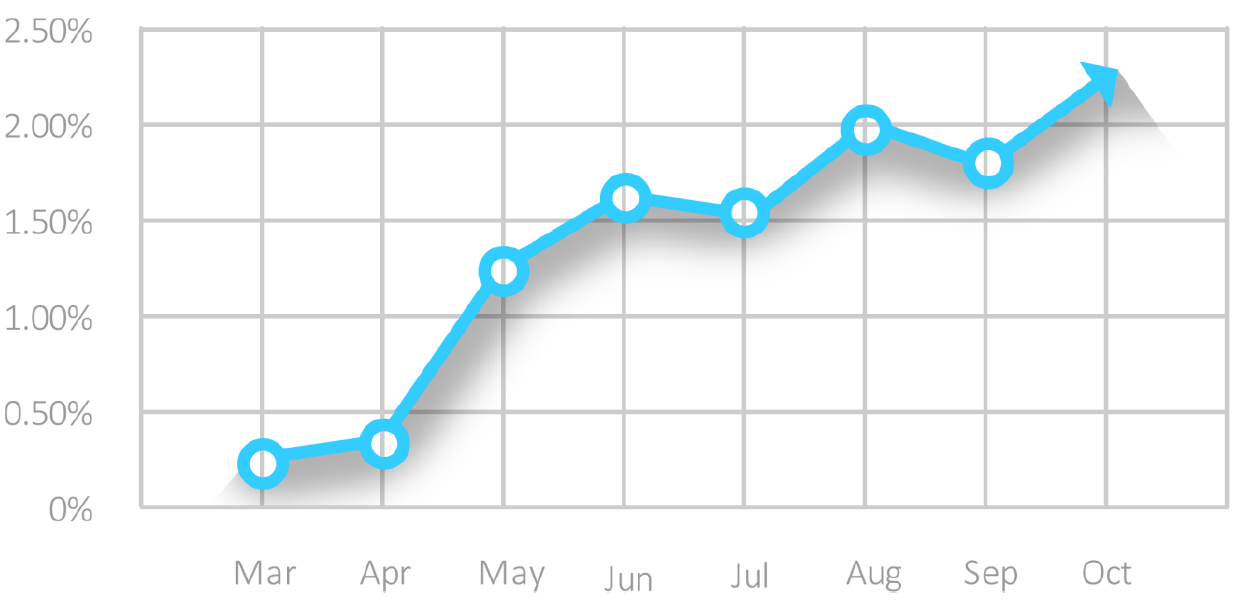
The click through rate dramatically increased over 900%. better written Ads and bid adjustments helped a lot! From 0.32% to 2.91% in 10 months.
Cost per Conversion
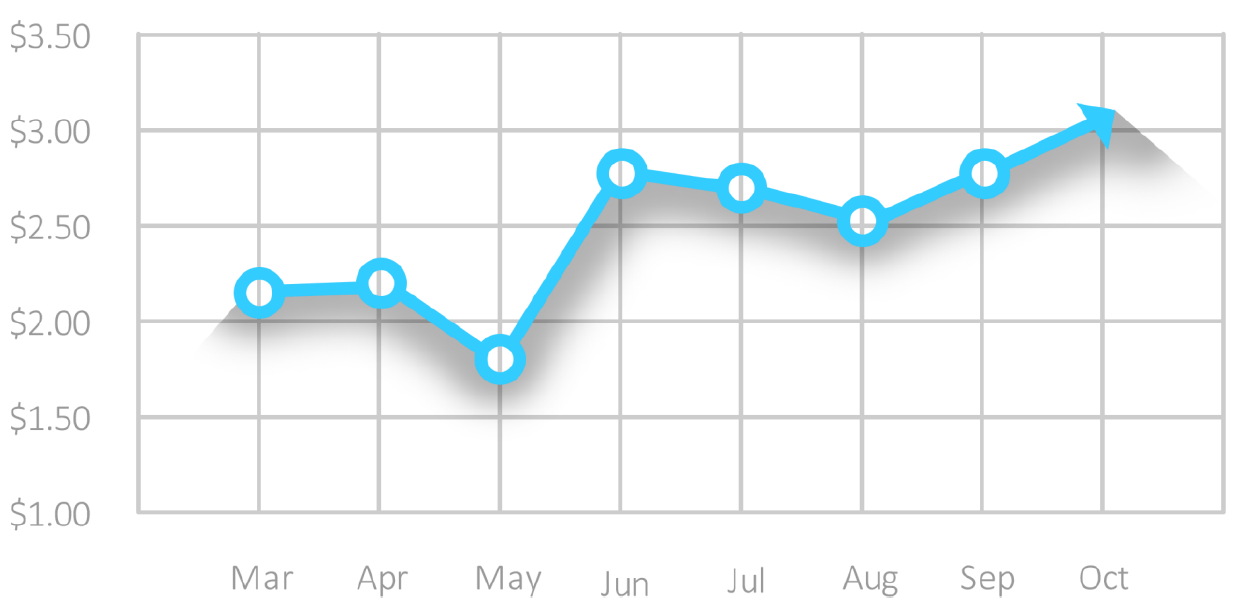
From $58.17 to $35.15 we saved this campaign some money. Adding negative keywords and refining ads for better quality scores did the trick.
Conversion Rate
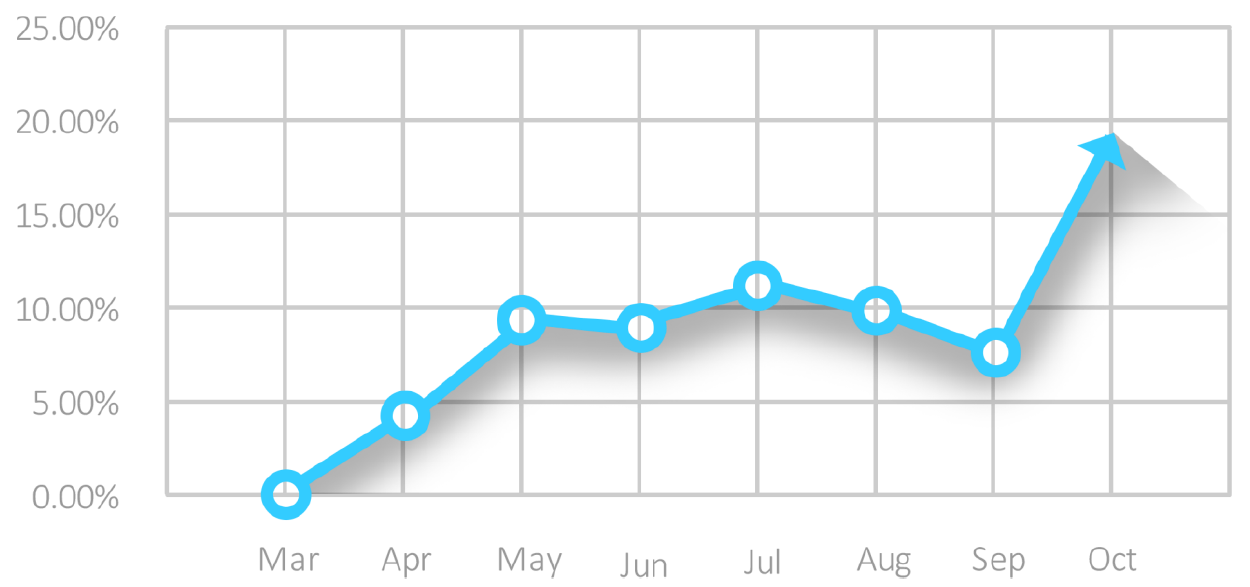
Increasing the clicks is just one part of this campaigns success. Making sure that the Landing Pages are effective and engaging will prompt traffic to interact and eventually convert.
Conversions
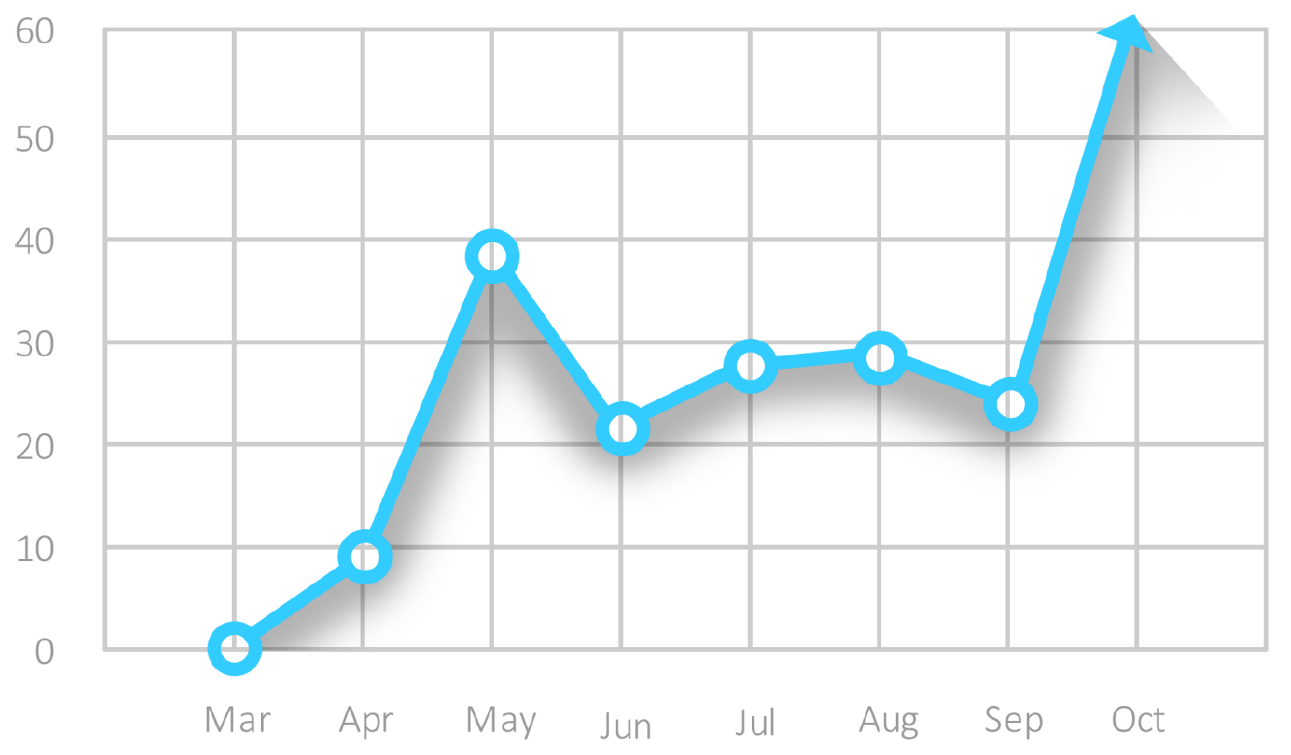
The last thing that we want to see on this campaign after all the efforts we’ve put in is to get conversions. Again, making sure that Ads are seen, correct bid adjustments, high quality score and effective landing pages helped a lot collectively in getting sufficient amount of conversions.