Case Study Project Page
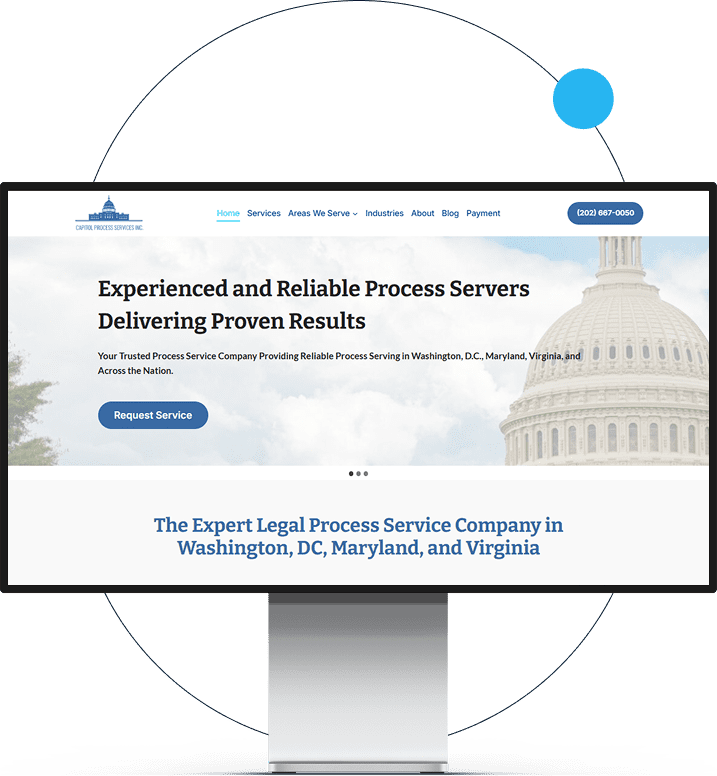
Capitol Process
Capitol Process is a process serving company operating across DC, Maryland, Virginia, Philadelphia, New York, Wilmington, Virginia Beach, and Richmond. When they came to Ruskin Consulting, their Google Ads account had tracking issues, unfocused search terms, and campaigns that weren’t scaling efficiently.
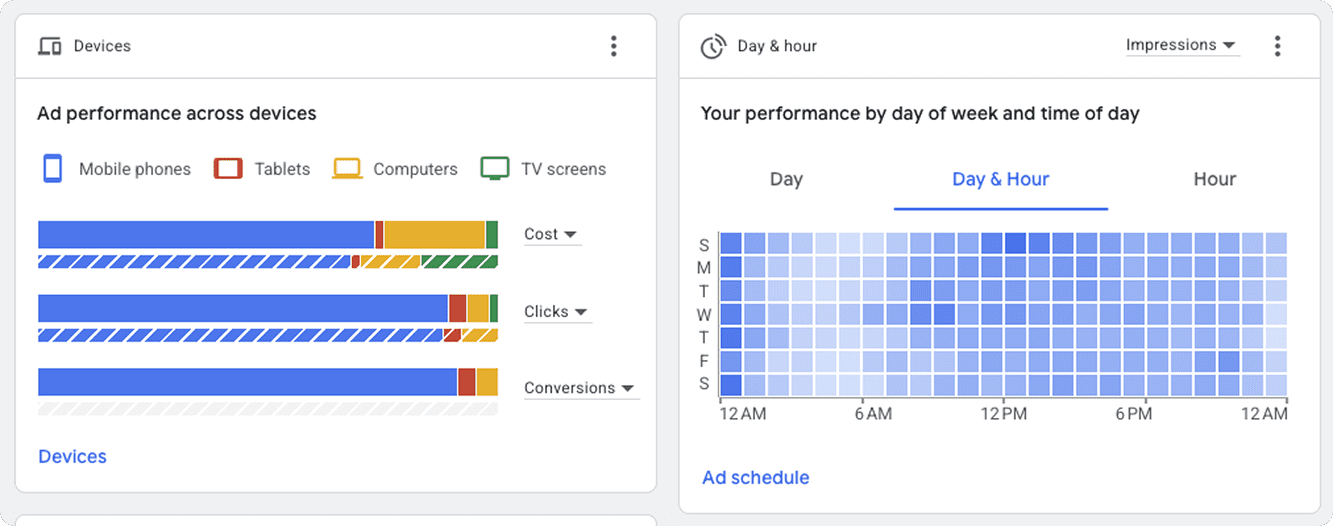
We audited and corrected conversion tracking, tightened search term targeting to cut wasted spend, then shifted budget into Performance Max campaigns to take advantage of Google’s automation and expand reach across all placements. The results were significant across every key metric.
Growth and Impact
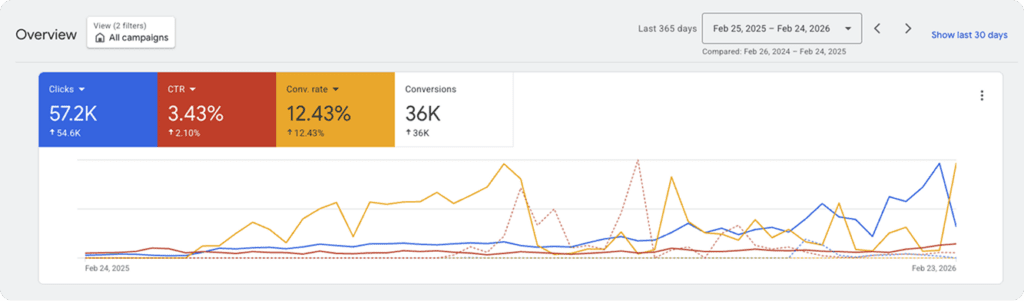
57.2K
Total Clicks
+54.6K YoY
36K
Conversions
+36K YoY
12.43%
Conversion Rate
+12.43% YoY
3.43%
Average CTR
+2.10% YoY
The Challenges
The Solutions
Before vs. After Results
|
Metric |
Before (Prev. Period) |
After (Last 365 Days) |
|
Total Clicks |
Baseline |
57,200 Clicks |
|
Conversions |
Baseline |
36,000 |
|
Conversion Rate |
Baseline |
12.43% |
|
Average CTR |
1.33% |
3.43% |
|
Avg. Cost / Click (PMax) |
~$2.22 |
$0.04-$0.11 (PMax) |
|
Campaign #1 Cost / Conv. |
Baseline |
$0.30 |
|
Tracking Accuracy |
Broken / Unreliable |
Fully Validated |
What We Did
The first step was getting the data right. The existing conversion setup had gaps that were causing Google to optimize against incomplete signals. We rebuilt tracking from the ground up, verified it across all campaigns, and only moved forward once we had clean, reliable data flowing into the account.
With accurate conversions in place, we went deep on search terms. Legal document serving attracts a broad range of searchers, and not all of them are ready to hire. We pulled every search term report, identified the patterns that were draining budget, and built out negative keyword lists by state and service type. This alone tightened the funnel significantly.
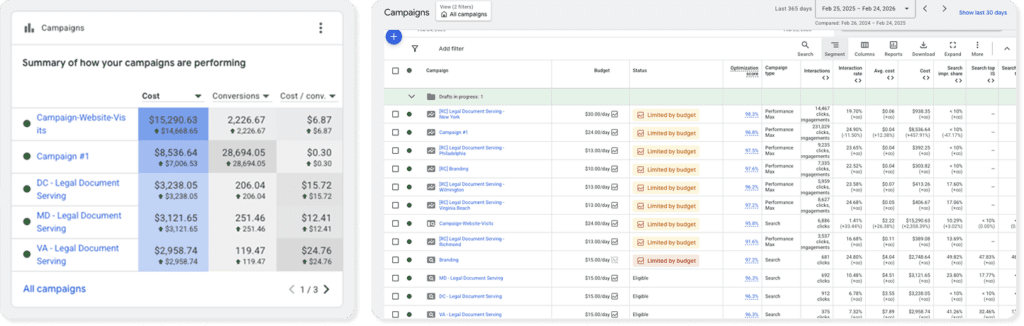
From there, we leaned into Performance Max. Rather than trying to manually manage placements across Search, Display, YouTube, and Discovery, PMax let Google’s automation work across all of them with a single campaign. We fed it strong creative assets and audience signals, then let it find the highest-converting users at scale. The results backed the strategy: Campaign #1 alone drove 28,694 conversions at $0.30 per conversion, and the PMax campaigns for individual states consistently hit 23-25% interaction rates at fractions of a cent per click.
Across the full account, the campaign structure now mirrors the business: each state has its own campaign, budgets scale with local demand, and every dollar spent is tracked back to a real conversion.
Campaign Breakdown
|
Campaign |
Total Cost |
Conversions |
Cost / Conv. |
Opt. Score |
|
Campaign-Website-Visits |
$15,290.63 |
2,226.67 |
$6.87 |
95.8% |
|
Campaign #1 (PMax) |
$8,536.64 |
28,694.05 |
$0.30 |
96.8% |
|
Capitol Process – DC |
$3,238.05 |
206.04 |
$15.72 |
96.3% |
|
Capitol Process – MD |
$3,121.65 |
251.46 |
$12.41 |
96.3% |
|
Capitol Process – VA |
$2,958.74 |
119.47 |
$24.76 |
96.3% |
|
RC Branding (PMax) |
$303.82 |
7,335 Interactions |
$0.04/Interaction |
97.6% |
|
Philadelphia (PMax) |
$392.25 |
9,235 Interactions |
$0.04/Interaction |
97.5% |